supplement
| home |
| supplement |
| use K2D2 |
| contact us |
This page contains instructions on how to run the server, as well as supplementary information to the manuscript describing K2D3:
- How to run the server: a detailed description of the input.
- Result: the output description.
- Supplementary data: supplementary figures and tables from K2D3 publication.
How to run the server
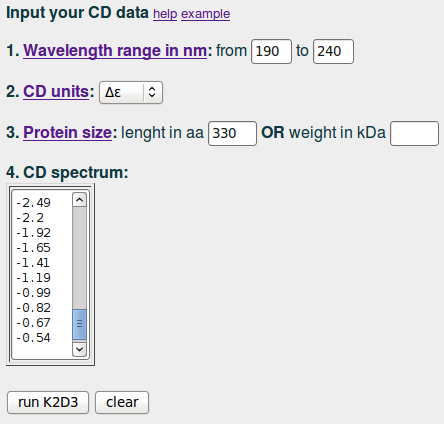
K2D3 reads in four pieces of input data from which only one (the protein size) is optional.
To succesfully run a query you must at least input: the wavelength range of the spectrum data (1), the units in which the spectrum comes (2),
and the CD spectrum itself (4). In addition to these, if you know the size of your protein (3), either the lenght in aminoacids (preferred) or its molecular weight in kDa, you could obtain better results (see K2D3 publication). For more information about CD spectra obtaining and their
units you can consult (Kelly et al.(2005) Biochimica et Biophysica Acta 1751: 119-39. PMID:16027053)
(1) Wavelength range in nm: any interval included in the [190,240] nm range with data at least below 230 nm.
(2) CD units: must be given either in deciliter mol^-1 cm^-1 (difference in molar extinction coefficients, Δε, also called molar circular dichroism) or in deg cm^2 dmol^-1 per residue (mean residue ellipticity units, MRE).
(3) Protein size: input the length of the protein in aminoacids or the molecular weight in kDa. This parameter is optional but recommended.
(4) CD spectrum: paste the spectrum in the window in a column format (see the example). The number of
values must match the length of the interval sperified in (1): missing values will give an error.
To run the server for the CD spectra of the lactate dehydrogenase in the example. We input '190' and '240' in (1); we select Δε in (2), input '330' in (3) and paste the data values in (4):
| input example |
|
Next, we click on 'run K2D3'.
Result
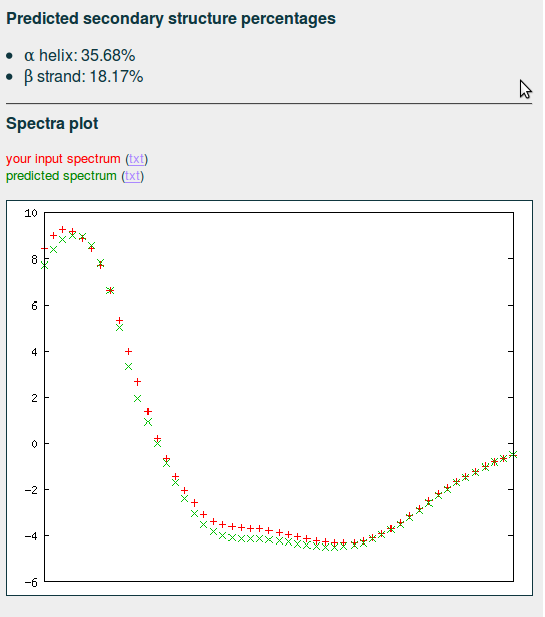
The predicted percentages of α helix and β strand are displayed, together with a plot of the query CD and an inferred CD constructed from the most similar CDs in the database, weighted by their distances to the query CD whom should match closely. In other case, specially if the deviation is substantial, please verify that the selected units of the input CD are correct.
| output example |
|
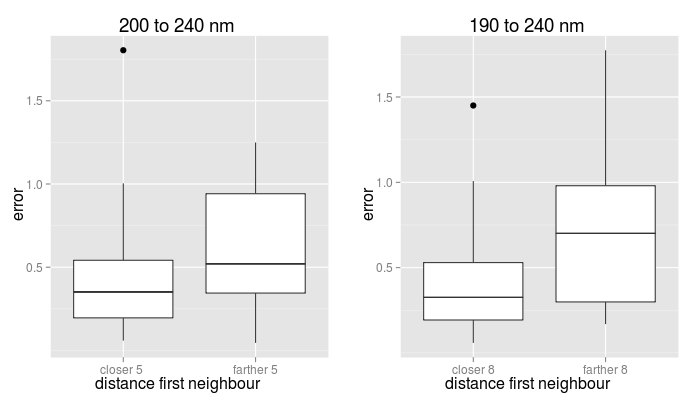
If the distance between the query CD and the most similar CD in the dataset is larger than a threhold, a warning is displayed. In our benchmark, we observed that when the distance to the closest neighbour was small the predictions were in general more accurate. A likely explanation is that very similar proteins exist in the database with a "regular" CD. In particular, for the 190 to 240 nm interval, 80% of the proteins had a closest neighbour at less than 7.5, for which 70% had a maximum total error smaller than 0.45, with a median value of 0.32. For the 200 to 240 nm interval, 80% of the proteins had a closest neighbour at less than 4.8, for which 64% of them the maximum total error was under 0.45, with a median value of 0.35 (see figure below). Accordingly, the server alerts when the closest neighbour to the query protein is at a distance farther than 5 or 8, respectively, as this may indicate that the total error could be large. This does not mean, however that the true error for the prediction is as high.
| Boxplots of total errors distributions in the benchmark |
|
Supplementary data
- Web table 1: Proteins of the reference dataset of theoretical spectra calculated with DicroCalc
PDB ID: chain identifier; %unknown aa type, %incomplete coord, %missing coord, %incomplete side chain coord: percentages of unknown aminoacids types and incomplete or missing coordinates in the PDB structure; resolution: resolution in Amstrongs; #chains, #heterogens, #types of heterogens: number of chains and heteroatoms and types of heterroatoms; Length: sequence length in aminoacids; Method: X, crystalography. N, NMR; Redundant chains: PDB chains that clustered with that leader; α-helix fraction, extended β-sheet fractions, other conformational structures fraction: obtained with DSSP.
- Web table 2: Predictions on BENCH83 by K2D3
query.pdb: PDB of the query protein structure's; query.alpha: alpha helix fraction of the query protein; K2D3.alpha: alpha-helix fraction prediction by K2D3; query.beta: beta-strand fraction of the query protein; K2D3.beta: beta-strand fraction prediction by K2D3; absError.alpha: absolute error of the alpha-helix fraction prediction; relError.alpha: relative error of the alpha-helix fraction prediction; absError.beta: absolute error of the beta-strand fraction prediction; relError.beta: relative error of the beta-strand fraction prediction. This table contains two sheets corresponding to studies on the 200 to 240 and 190 to240 intervals, respectively.
- Web table 3: Performance comparisons of K2D2 and K2D3 on the PCDDB subset of BENCH83.
query.pdb: PDB of the query protein structure's; DSSP.alpha: alpha helix fraction of the query protein; K2D2.alpha: alpha-helix fraction prediction by K2D2; K2D3.alpha: alpha-helix fraction prediction by K2D3; DSSP.beta: beta-strand fraction of the query protein; K2D2.beta: beta-strand fraction prediction by K2D2; K2D3.beta: beta-strand fraction prediction by K2D3; absError.alpha.DSSP_K2D2, absError.alpha.DSSP_K2D3: absolute error of the alpha-helix fraction prediction by K2D2 and K2D3; relError.alpha.DSSP_K2D2, relError.alpha.DSSP_K2D3: relative error of the alpha-helix fraction prediction by K2D2 and K2D3; absError.beta.DSSP_K2D2, absError.beta.DSSP_K2D3: absolute error of the beta-strand fraction prediction by K2D2 and K2D3; relError.beta.DSSP_K2D2, relError.beta.DSSP_K2D3: relative error of the beta-strand fraction prediction by K2D2 and K2D3; delta_absErrorsAlpha.K2D2_K2D3, delta_absErrorsBeta.K2D2_K2D3, delta_relErrorsAlpha.K2D2_K2D3, delta_relErrorsBeta.K2D2_K2D3: differences between K2D2 and K2D3 errors. This table has two sheets corresponding to studies on the 200-240 and 190-240 intervals, respectively.