K2D: Supplement

Supplement

K2D2 is a method to estimate protein secondary structure from circular dichroism (CD) spectra. It uses a self-organized map (SOM) of spectra from proteins with known structure to deduce maps of protein secondary structure that are used to do the predictions.

Reference set of protein spectra

We used the reference set CDDATA.43 from the excellent web site CDPRO (see CDPRO Id & protein name in table 1). We selected best resolution tertiary structures for the reference set proteins from the Protein Data Bank (see PDB id in table 1). We used the DSSP program to assign secondary structure class to the aminoacids (as α helix to H, β strand to E) and normalize to the fractions of the total number of aminoacids (see DSSP table 1).

Secondary structure maps

We start with grids of 18 X 18 nodes (same size as the SOM). Given a spectrum, we find its "closer" neuron in the SOM map, and we assign the fraction of secondary structure of the corresponding protein to the equivalent (same coordinates) node in the grid. For more details on the method basics see the original K2D publication (PMID: 8332596). In order to produce smooth maps (see figure 1), instead of considering only the closer neuron in the spectra SOM we take into account a number n of the closest neurons, and the final value of secondary structure fraction is the linear combination of the values of the respective neurons weighed by the inverse of their distances. The inclusion of more than 6 neighboring neurons produced the best results. Better performance was obtained when not including the extra six reference spectra from in the computation of the secondary structure map, although performance decreased if we removed them as well from the training set of the spectra SOM.

figure 1

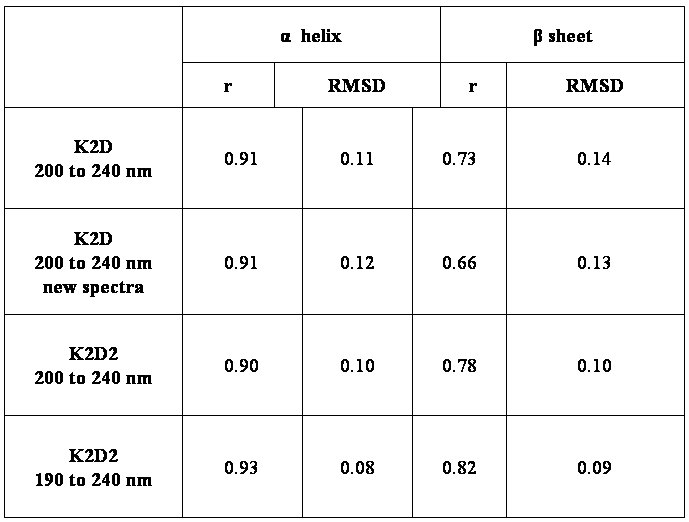
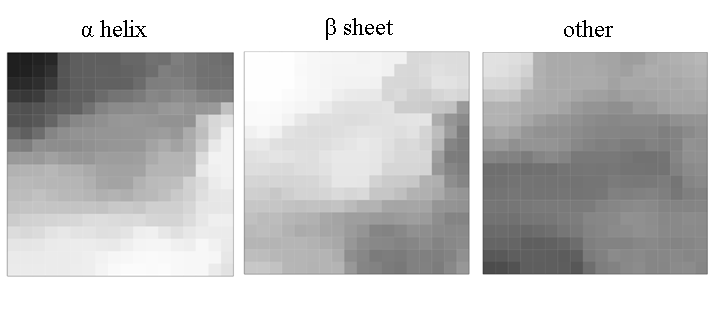
figure 1. Representation of the secondary structure map for α helix, β strand and other for the 190 to 240 nm wavelength range. Each node in the grid has associated values between 0 and 1 corresponding to the fractions of the secondary structure types: α helix, β strand and other. The values are represented in grey scale (0 is white and 1 is black).

Benchmark

A left-one-out benchmark was performed wih each protein from CDDATA.43. We compare real values of helix and strand content (assigned by DSSP to the PDB structure file) with predicted values from the method (see table 1). The error colums in table 1 correspond to the sum of the absolute values of the differences between real and predicted for the three classes &alpha, &beta and other. The global accuracy was measured by Pearson correlation coefficient (r) and the root mean square deviation (RMSD) (see table 2).

table 2

table 2. Benchmark results of K2D and K2D2.

Estimated maximum error

In principle, the more similar a given spectrum is to its closest SOM spectra node, the better would be the prediction. In other words, if a spectrum is very different to anything the method has "previously seen" (as for training set), results are not expected to be very accurate. To provide users with an estimate of the maximum total error of the prediction, i.e. the sum for the α error and β error predictions, we used the benchmark distances to the closest node map and the corresponding observed total errors. At a given distance, the max error is the largest total error observed in the benchmark. So, the total error of the prediction is expected to be less than the given max error.

[K2D2 Home]