
MIPPIE How-to
- Generation of reliable and meaningful PPI networks with MIPPIE.
- Confidence scoring of experimentally measured interactions.
- Query interactions.
- Network construction.
- Exporting query results.
- Disease and Gene Ontology enrichment of query results.
- Browsing the MIPPIE proteome.
- Cytoscape visualization of MIPPIE output.
- MIPPIE network construction script.
- Annotation of a list of newly measured interactions.
- Download the repository.
- Example of a MIPPIE workflow.
- Sources.
- MIPPIE API.
- General technical remarks.
- Related manuscripts (how to cite).
- Contact.
Generation of reliable and meaningful PPI networks with MIPPIE
Welcome to MIPPIE (the Mouse Integrated Protein Protein Interaction Reference)! We provide confidence scored and functionally annotated mouse protein-protein interactions (PPIs). This page contains details on the information stored in MIPPIE and the multiple ways to access it. First time users might want to start with the walk-through example to get an idea of what types of analyses can be performed with MIPPIE.Back to top
Confidence scoring of experimentally measured interactions
A core component of MIPPIE is the confidence scoring of interactions based on the amount and reliability of evidence supporting them. This score is calculated as a weighted sum of the number of studies in which an interaction was detected, the number and quality of experimental techniques used to measure an interaction and the number of non-mouse organisms in which an interaction was reproduced.The parameters of this scoring scheme were jointly optimized by a group of experts and a computer algorithm. We first assigned quality scores to each experimental technique that measures protein-protein interactions. This experimental quality score is supposed to reflect the reliability and the error rate of the techniques. The list of experimental quality scores can be found in the Download section. We are aware that, to a high degree, the estimation of experimental quality is led by the individual perception and experience of our expert team and can only reflect our subjective beliefs. If you feel that a technique was fundamentally misjudged, please give us your feedback.
Also, there is the possibility for users of MIPPIE to modify the scores and to apply our rescoring tool to get an individually scored version of MIPPIE. Please, find a stand-alone version of the tool and instructions on how to run it in the Download section.
Back to top
Query interactions
The query mode allows for querying MIPPIE with a UniProt accession, gene symbol, Entrez gene id or MGI id. All interactions in MIPPIE that match the query protein are displayed.On the result page, UniProt id, Entrez gene id and gene symbol of the interactors of the query protein are indicated. The confidence score of the interaction is given in the last column. Clicking on it opens an evidence page where the source databases of the interaction are listed, together with the publications which mention the interaction, the experimental systems used to detect it and the species in which it is conserved.
Back to top
Network construction
In the network construction mode, several proteins (or interactions) can be queried at the same time ("batch mode") and a network is constructed from the input. The resulting network can be either visualized graphically, listed in a tabular format in the browser or downloaded as a file in several formats.Input
In the network construction mode, MIPPIE can be either queried with a list of proteins or a list of interactions (a maximum of 100 lines is allowed, that can be either pasted into the query field or uploaded as a file). Each line must contain a single protein or a protein pair (separated by a tab or whitespaces). Allowed identifier types are: UniProt accessions, gene symbols, Entrez gene ids or MGI ids.The main goal of this mode is to allow users to construct networks around proteins of interest or around experimentally measured protein interactions. For that purpose, also interacting protein pairs can be used as seeds for the network construction and both the input interactions and interactions from MIPPIE will be displayed in the resulting network. Proteins and interactions submitted by the user are highlighted in blue in our graphical output and, in case they are not in MIPPIE, they are highlighted in red. Several filter criteria allow to modify the resulting network (see below). Note, however, that these filters are only applied to interactions added from the MIPPIE repository and do not affect the input proteins or interactions, which will be displayed regardless of whether they pass the filter criteria or not.
Back to top
Output type
The user can choose between different output types.- show in browser - text: output the table of interactions in the browser
- show in browser - visualization: use Cytoscape.js to visualize the constructed subnetwork
- MIPPIE tab file format: the interactions are written to a simple text file
- PSI-MI TAB 2.5 output format: interactions are written to the standardized MITAB format
Interaction layers
The size of the network can be modulated by choosing the interaction layer size:- 0 - only interactions within the input set are considered
- 1 - all interactions in which members of the input set participate are listed
Back to top
Min. number of PPIs to query set
This output parameter is useful when the user wants to know whether the query set has one or more common interactors. The default value of 1 simply queries for proteins interacting with the query set. However, a value of 2, for example, focuses on proteins that interact with at least 2 members of the query set.Note that only integer values greater or equal to 1 are valid. Values below 0 are reset to 1 and fractions are rounded.
Back to top
Score filter
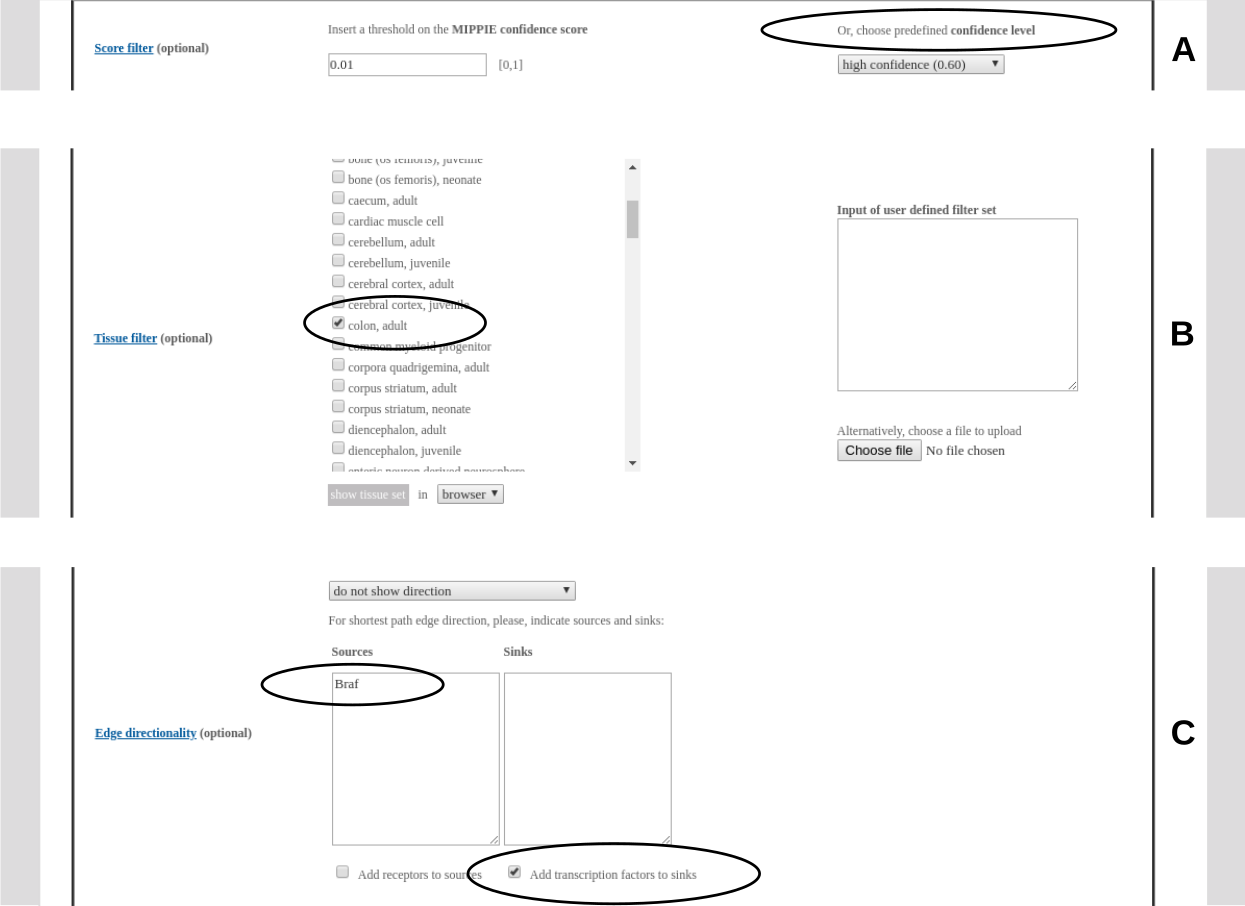
A threshold on the MIPPIE confidence score can be chosen. The user can either specify a custom value between 0 and 1 or choose a predefined confidence level: medium confidence (0.53 - second quartile of the MIPPIE score distribution) or high confidence (0.60 - upper quartile). If both custom and predefined thresholds are selected, the higher one is applied.Note, that the confidence filter is not applied to interactions uploaded by the user.
Back to top
Interaction type filter
MIPPIE offers an interaction type filter to distinguish between binary and complex interactions. For the interaction type filter, we rely on the annotation of interactions from MINT, BioGRID and IntAct. We offer to select interactions annotated with the PSI-MI categories association (MI:0914), physical association (MI:0915), direct interaction (MI:0407) and colocalization (MI:0403).Back to top
Tissue filter
Interactions can be filtered for tissue specificity. Several tissue filters can be selected at the same time by ticking more than one tissue from the menu. For an interaction to pass this filter, both interactors should be expressed in at least one of the selected tissues.It is also possible to upload user defined filter sets (e.g. results from microarray or RNA-seq experiments), which are used instead (if no tissues are selected) or in addition (if there are selected tissues) to the predefined tissue filter sets.
The tissue expression data was taken from here. A gene was considered to be expressed in a given tissue if it showed an RPKM >= 1.
Functional filter
Interactions can be filtered for annotation of GO and MeSH terms. Interactions are associated with the lowest common ancestor within the hierarchy of terms associated with the interacting proteins. Selection of a more generic term causes interactions annotated with a more specific term to pass the filter.Back to top
Directed edges
MIPPIE infers edge directionality by calculating the shortest paths that connect sources with sinks to infer information flow in signaling networks. The source and sink sets can be specified by pasting gene lists into the respective input fields. Receptors and transcription factors (according to the Cell Surface Protein Atlas and the AnimalTFDB) can be selected as default source and sink sets, respectively. The shortest path computation is done with the python package NetworkX (https://networkx.github.io/). The user can choose between two ways of shortest path computation: 1. All shortest paths consisting of the same number of edges (not considering edge weights) are highlighted ('show unweighted shortest paths'). 2. If there are several shortest paths consisting of the same number of edges, only the one with the highest cumulative confidence score is shown ('show confidence-weighted shortest paths').Alternatively, for known pathways, SIGNOR's directionality assignment can be displayed. Edge directionality is indicated in the visual output mode with arrows. Sources and sinks are color-coded. In the tabular output mode (browser or download) an additional column indicates the direction.
Back to top
Inhibitory or activating effect of an interaction
We considered the inhibitory and activating effect of interactions based on the annotations provided in the SIGNOR database. The effect information is visually encoded in the graph visualization output mode by edges terminating in either arrows (activation) or bars (inhibition). If the effect visualization is chosen in combination with edge directionality, a diamond-shaped arrow indicates that an edge has a direction but not an effect. Edges with two arrows have an effect but not a direction. In addition to the visual encoding, the interaction effects can be shown in the tabular output.Back to top
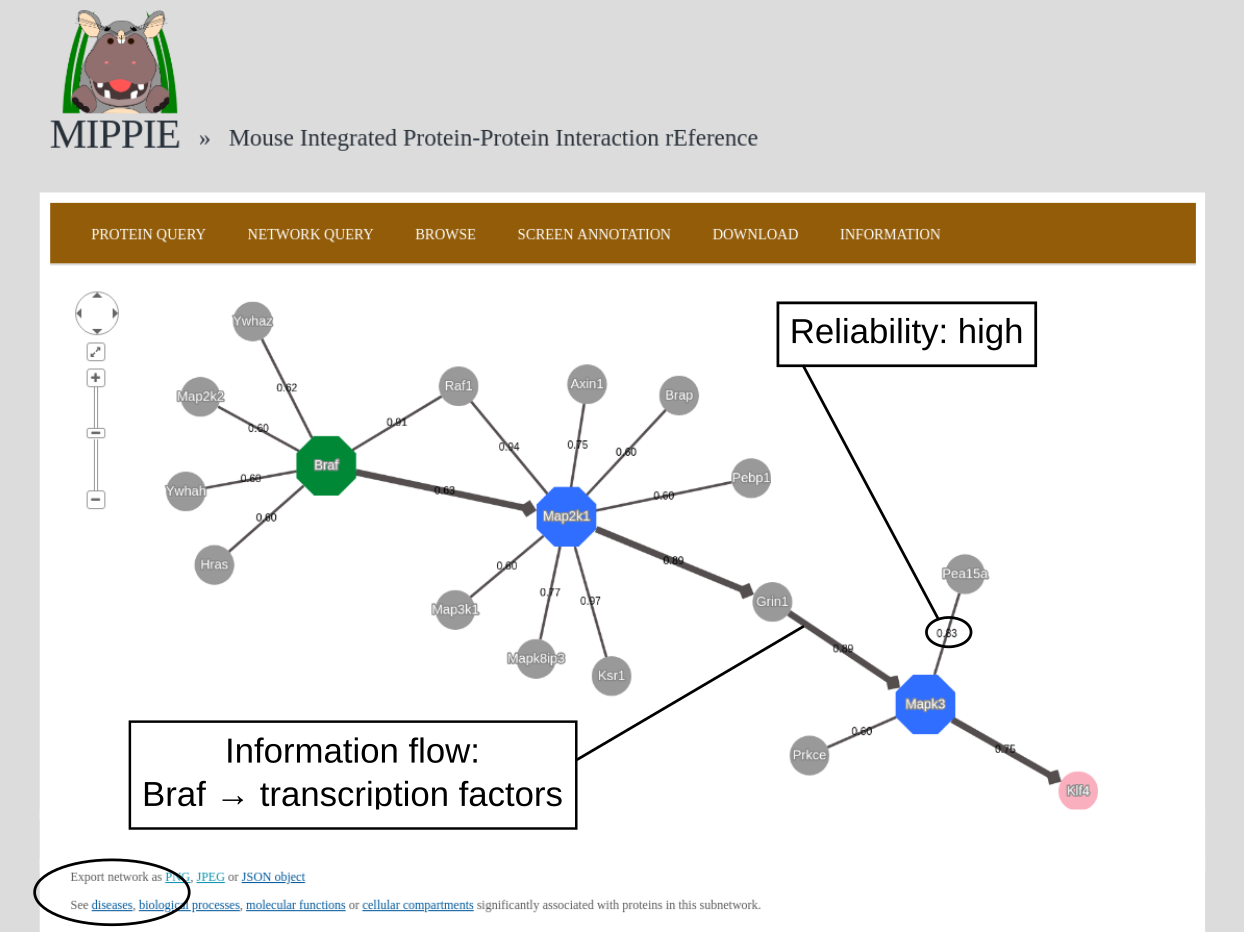
Exporting query results
The browser-based results of the above-mentioned
protein
and network
queries can be copied or downloaded as tab-separated text files (TSV format).
When the network visualization output is chosen in the network query, the resulting
Cytoscape.js representation of the subnetwork can be saved as a PNG or JPEG graphic,
or as a JSON object. Note that some browsers require resizing of the window containing
the PNG or JPEG graphic for it to be visualized.
Back to top
Disease and Gene Ontology enrichment of query results
It is possible to perform a Disease Enrichment Analysis with the proteins resulting from a protein or
network query. The set of diseases that are significantly associated to the partners of a protein or the members of a subnetwork is shown,
respectively. This analysis is performed with the help of the text mining tool Gene set to diseases, which computes a disease enrichment
analysis on gene sets, using biomedical literature data (click here for more details).
It is also possible to perform a Gene Ontology Enrichment Analysis of the proteins resulting from a protein or
network query. The analysis is performed via PANTHER, the preferred tool of the
Gene Ontology Consortium (click here for more details).
These analyses are restricted to 1000 proteins.
Back to top
Browsing the MIPPIE proteome.
The browsing mode in MIPPIE allows for the exploration of the entire set of proteins in the database and presents summary
statistics about the network members. UniProt, Entrez, MGI and Symbol IDs, node degree (i.e. the number of interaction partners), average score of adjacent edges and a link to query interaction partners are shown
for each protein in a big table. Note that loading the entire MIPPIE proteome may take a few seconds, depending on the type of Internet connection being used.
Back to top
Cytoscape visualization of MIPPIE output
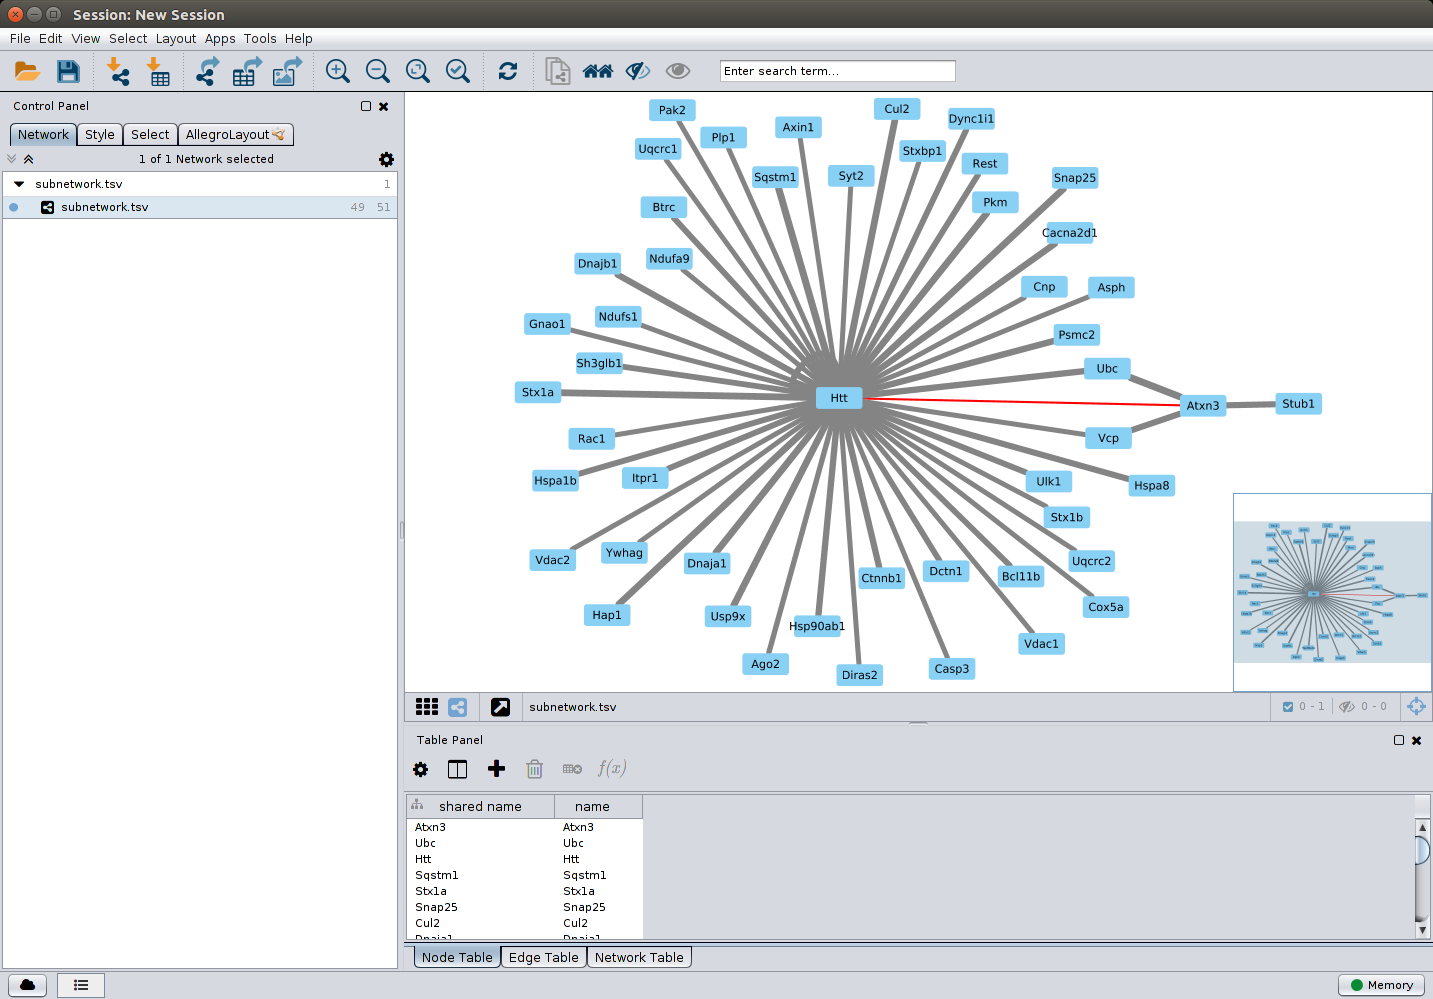
MIPPIE offers to display any constructed subnetwork with the light-weight network visualization tool Cytoscape.js. However, for more detailed analyses, we recommend using MIPPIE's export facilities and using the desktop version of Cytoscape. The MIPPIE tab format is specifically designed in a way that important features of interactions are listed in separated columns and can be easily imported into Cytoscape as edge features. For that purpose choose 'File' -> 'Import' -> 'Network from table' in Cytoscape. Select a file exported from MIPPIE and activate the columns which should be imported.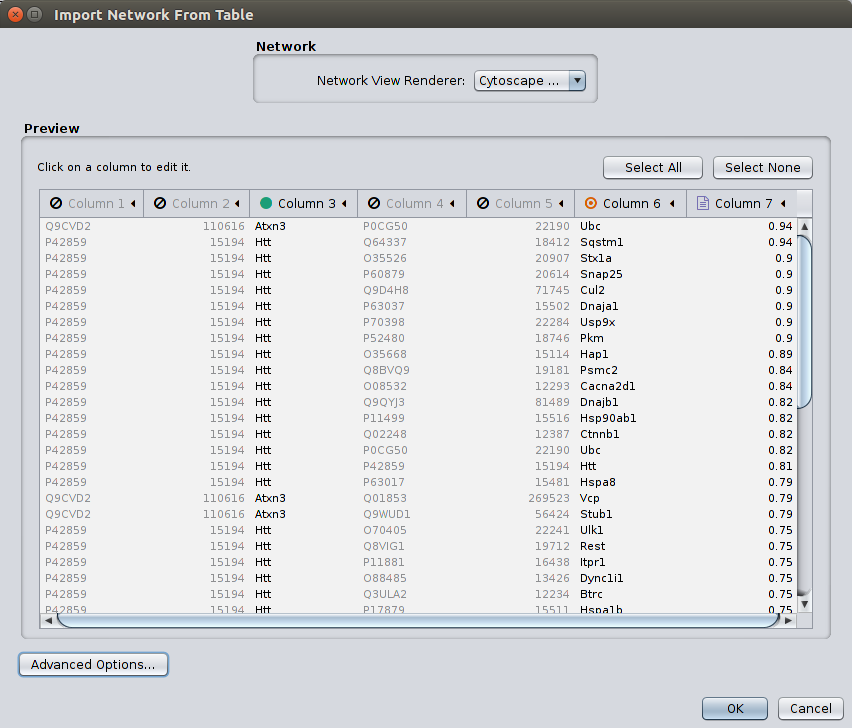
Alternatively, a visual representation of the network can be generated using
MIPPIE and Cytoscape.js and then exported for further analyses. The available
JSON format can be imported into Cytoscape (requires Cytoscape version 3.1.0 or newer).
Back to top
MIPPIE network construction script
For large input sets or queries involving indirect neighbors (layer-2 or -3 interactions), we developed a script that can be downloaded and run locally. It is implemented in R, making it platform-independent. Instructions on how to use it can be downloaded together with the tool from the Download page.Back to top
Annotation of a list of newly measured interactions
MIPPIE aims at serving experimentalists conducting large scale screens for protein-protein interactions. Hence, it offers a service in which a result table from such a screen is annotated with information on which interactions have been observed before and how reliable they are under MIPPIE's scoring scheme. The input format is very flexible, allowing the user to select from different ID types (Uniprot and Entrez), indicate the columns where the interactors are listed and specify parameters for the input format (which characters separate columns and whether there is a preceding header line).Back to top
Download the repository
The most important information about the protein interactions stored in MIPPIE, as well as the data associated with each protein, can be downloaded from the Download tab. The files available for download are in the tab-separated format to facilitate their analysis with tools such as Cytoscape, Gephi, R or Python.The protein interaction file contains the Entrez gene IDs of the two proteins involved in the interaction, the MIPPIE confidence score for the interaction, the type of interaction, the databases and studies that report it, the taxonomic IDs of other organisms in wich the interaction takes place and the experimental techniques used to measure the interaction.
The protein file contains the Entrez gene ID, official gene symbol, Uniprot accession and MGI ID of each protein in MIPPIE.
Back to top
Example of a MIPPIE workflow
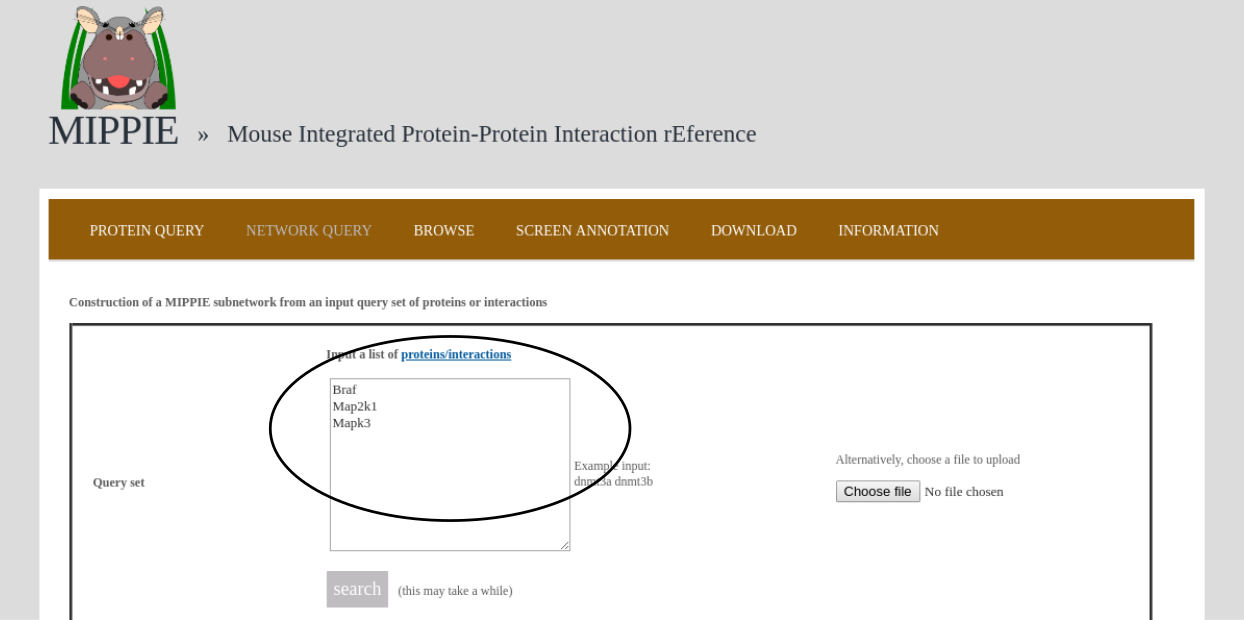
To demonstrate MIPPIE's functionality, we give a simple example of a typical query that makes use of expression data and shortest paths computations.We start from the NETWORK QUERY tab. The user can enter a list of proteins or protein pairs (separated by a space or tab, which will then be interpreted as interacting proteins) into the up-most text field (encircled below). In this example, we want to explore MIPPIE's functionality to construct context-specific signaling networks. We therefore query MIPPIE with the kinases Braf, Map2k1 and Mapk3, which are members of the Mitogen-activated protein kinase (MAPK) signaling cascade and activate each other in the stated order.
The resulting network can be further analysed. One option is to identify diseases overrepresented among the proteins in the network. To this end, the proteins in the network will be automatically transferred to the tool "Gene set to Diseases" (Fontaine & Andrade-Navarro. Genomics and Computational Biology. 2016) when the link in the circle is clicked.
Back to top
Sources
MIPPIE integrates interaction data from 9 source databases. The chart below shows the number of PPIs contributed by each source. The bar plot was created using Google chart tools.Back to top
MIPPIE API
MIPPIE users can query the resource via our REST web service. This means that MIPPIE can be easily integrated in any Bioinformatics pipeline using the following template:http://cbdm-01.zdv.uni-mainz.de/~galanisl/mippie/queryMIPPIE.php?proteins=xxx,xxx;xxx|xxx&layers=xxx&conf_thres=xxx&out_type=xxx
- proteins = One or more proteins of interest separated by ",", ";" or "|" (mandatory).
- layers = 0 to query interactions within the input set or 1 to query interactions between the input set and MIPPIE (optional, default = 1).
- conf_thres = Only protein interactions with confidence scores above this threshold, which can range between 0 an 1, are considered (optional, default = 0).
- out_type = The query output format. browser shows the list of interactions in a table in MIPPIE, viz shows a network visualization, mitab generates a MITAB file and conc_file generates a simple tab-separated text file (optional, default = conc_file).
Back to top
General technical remarks
MIPPIE works best with a recent version of Mozilla Firefox (≥3.6.). We observed problems with Microsoft Internet Explorer. While we are fixing these problems, we recommend you to visit MIPPIE with a different web browser.Back to top
Related manuscripts
- Alanis-Lobato G, Möllmann JS, Schaefer MH & Andrade-Navarro MA (2020) MIPPIE: the mouse integrated protein–protein interaction reference. Database, 2020:baaa035 [link]
- Schaefer MH, Fontaine J-F, Vinayagam A, Porras P, Wanker EE, et al. (2012) HIPPIE: Integrating Protein Interaction Networks with Experiment Based Quality Scores. PLoS ONE, 7(2): e31826 [link]
- Alanis-Lobato G, Andrade-Navarro MA, & Schaefer MH. (2016). HIPPIE v2.0: enhancing meaningfulness and reliability of protein-protein interaction networks. Nucleic Acids Research, gkw985 [link]
Contact
Please send questions or comments on MIPPIE to: gregorio.alanisl@crick.ac.uk
MIPPIE is hosted by the CBDM group at the JGU in Mainz.Back to top