 | dAtabase of Polyx Evolution |
| Input & output overview |
| Query: Download | Time elapsed: 2 seconds | Clustered results: Download | Ortholog's multifasta file: Download | Ortholog's alignment (fasta format): Download |
| Cutoff6: - | Cutoff8: - | Cutoff10: - | Cutoff12: - | Cutoff14: - | Cutoff16: - | Cutoff18: - | Cutoff20: - | Cutoff22: - |
|
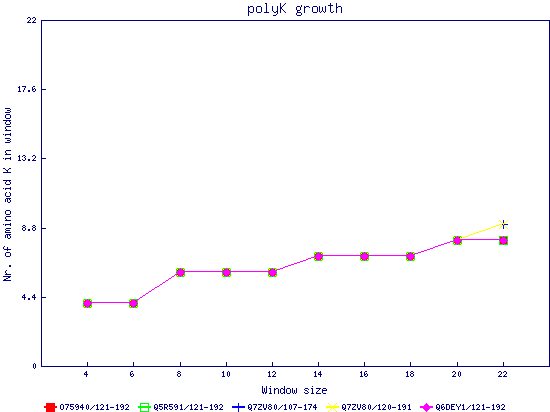
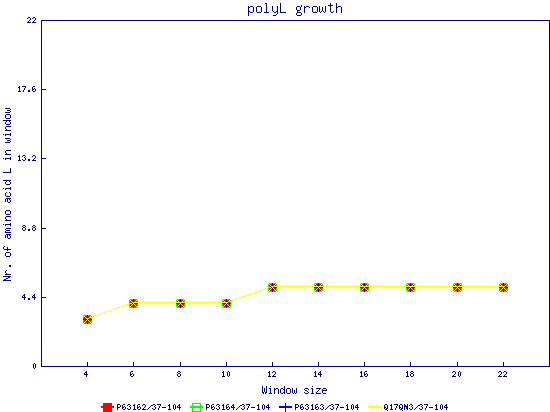
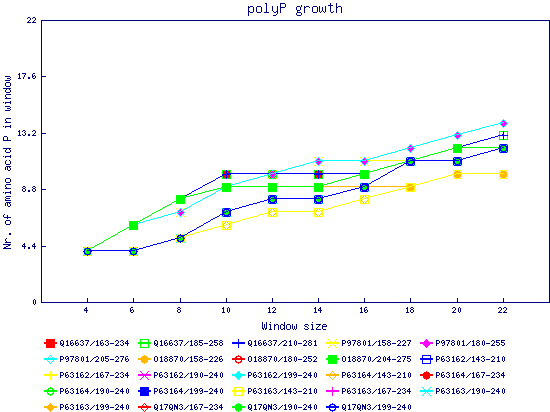
In this example, we used as query a mixed set of SMN, SPF30 and RSMN proteins. By default, the multiple sequence alignment of all of them is displayed below (tag "Raw results"), with their homorepeats showcased in different colors. Clicking in the tag "Clustered results", one can see the clustered results, and the sequences correctly distributed in three clusters. The distribution of the homorepeats in the three clusters is indeed very different, and homogeneus within them. To cluster the sequences, we used the standalone version of FastaHerder2 (PMID: 26828375), using a threshold of a minimum of 25% identity in the clusters. |
| Ortholog's alignment simplification, showing the position of the polyX regions | ||||||||||||||||||||
|
| |
|
|
||
| Q16637 P97801 O18870 P63162 O75940 P63164 P63163 Q17QN3 Q5R591 Q7ZV80 Q6DEY1 | 1 1 1 1 1 1 1 1 1 1 1 | ------------------------------------------------------------------------------------------------------------------------------------------------------------------------------------------------------ ------------------------------------------------------------------------------------------------------------------------------------------------------------------------------------------------------ ------------------------------------------------------------------------------------------------------------------------------------------------------------------------------------------------------ ------------------------------------------------------------------------------------------------------------------------------------------------------------------------------------------------------ ------------------------------------------------------------------------------------------------------------------------------------------------------------------------------------------------------ ------------------------------------------------------------------------------------------------------------------------------------------------------------------------------------------------------ ------------------------------------------------------------------------------------------------------------------------------------------------------------------------------------------------------ ------------------------------------------------------------------------------------------------------------------------------------------------------------------------------------------------------ ------------------------------------------------------------------------------------------------------------------------------------------------------------------------------------------------------ ------------------------------------------------------------------------------------------------------------------------------------------------------------------------------------------------------ ------------------------------------------------------------------------------------------------------------------------------------------------------------------------------------------------------ | 294 288 287 240 238 240 240 240 238 237 238 | |
*To visualize the actual sequence of a polyX, please go to the individual table of each amino acid (below). **Alignment represented in scale 1:2. |
| Ortholog's alignment simplification, showing the position of the polyX regions | ||||||||||||||||||||
|
| |
|
|
||
| Cluster 1 Q16637 P97801 O18870 Cluster 2 P63164 P63162 Q17QN3 P63163 Cluster 3 Q5R591 Q7ZV80 Q6DEY1 O75940 | 1 1 1 1 1 1 1 1 1 1 1 | ------------------------------------------------------------------------------------------------------------------------------------------------------------------------------------------------------ ------------------------------------------------------------------------------------------------------------------------------------------------------------------------------------------------------ ------------------------------------------------------------------------------------------------------------------------------------------------------------------------------------------------------ ------------------------------------------------------------------------------------------------------------------------------------------------------------------------------------------------------ ------------------------------------------------------------------------------------------------------------------------------------------------------------------------------------------------------ ------------------------------------------------------------------------------------------------------------------------------------------------------------------------------------------------------ ------------------------------------------------------------------------------------------------------------------------------------------------------------------------------------------------------ ------------------------------------------------------------------------------------------------------------------------------------------------------------------------------------------------------ ------------------------------------------------------------------------------------------------------------------------------------------------------------------------------------------------------ ------------------------------------------------------------------------------------------------------------------------------------------------------------------------------------------------------ ------------------------------------------------------------------------------------------------------------------------------------------------------------------------------------------------------ | 294 288 287 240 240 240 240 238 237 238 238 | |
*To visualize the actual sequence of a polyX, please go to the individual table of each amino acid (below). **Alignment represented in scale 1:2. |
Input sequences were clustered with FastaHerder2 (PMID: 26828375), using a threshold of a minimum of 25% identity in the clusters: | ||
| >1-(1:)sp|Q16637|SMN_HUMAN-(1:)sp|O18870|SMN_BOVIN;(1:)sp|P97801|SMN_MOUSE; >2-(1:)sp|Q17QN3|RSMN_BOVIN-(1:)sp|P63163|RSMN_MOUSE;(1:)sp|P63164|RSMN_RAT;(1:)sp|P63162|RSMN_HUMAN; >3-(1:)sp|Q7ZV80|SPF30_DANRE-(2:)sp|O75940|SPF30_HUMAN;(2:)sp|Q5R591|SPF30_PONAB;(2:)sp|Q6DEY1|SPF30_XENTR; | ||
| click on any graph to show the results per amino acid |
